Elevating Data Visualization with Modern Isometric Business Infographics
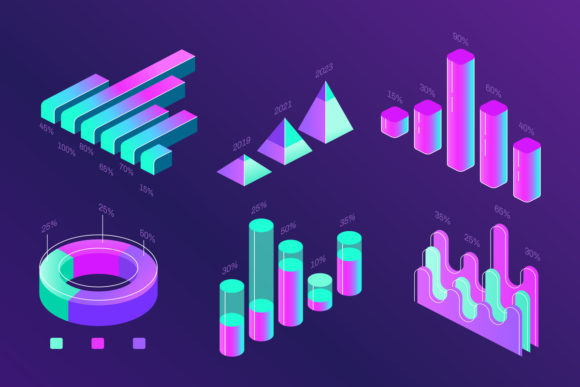
In the current digital landscape, capturing attention is only half the battle; retaining it through clear communication is where the real challenge lies. When presenting complex website data, financial statistics, or growth metrics, flat design often fails to convey the depth and dynamism of modern business. This is where the Modern Isometric Business Infographic becomes an essential asset for designers and marketers alike. By utilizing a specific color palette of vibrant purple and cyan, these 3D presentation concepts transform dry numbers into engaging visual narratives that resonate with contemporary audiences.
The Psychology of Purple and Cyan in Data Design
Color choice in infographic design is never accidental. The combination of purple and cyan serves a distinct functional purpose beyond mere aesthetics. In the context of a Modern Isometric Business Infographic, this duo creates a high-contrast environment that guides the viewer’s eye naturally across the composition. Purple often signifies wisdom, creativity, and premium quality, making it ideal for headers, primary data points, or background elements that suggest authority. Cyan, conversely, evokes feelings of technology, clarity, and freshness. It works exceptionally well for highlighting percentage info charts, active states in diagrams, or secondary statistical columns.
This specific pairing also addresses accessibility and screen fatigue. Unlike harsh reds or neon greens, the cool-toned spectrum of purple and cyan is easier on the eyes during prolonged viewing sessions, which is crucial for detailed analytical reports or dashboard presentations. When users encounter these colors in a 3D vector set, they subconsciously associate the content with innovation and forward-thinking analysis, setting a positive tone before they even process the actual data.
Understanding the Technical Deliverables
For creative professionals integrating these assets into their workflow, understanding the file structure is paramount. A high-quality Modern Isometric Business Infographic package typically includes two distinct files serving different stages of production. The primary deliverable is the Vector EPS10 file. This format is the industry standard for scalability and editability. Because it is vector-based, you can resize the statistic charts and diagrams to fit anything from a mobile app interface to a massive trade show banner without losing a single pixel of crispness.
The second component is usually a JPEG preview at 72ppi. While this raster image is not suitable for final print production, it plays a vital role in the selection and approval process. Art directors and clients can quickly review the JPEG to approve the layout and color balance without needing specialized software. Once approved, the designer moves to the EPS10 file for final customization. This dual-file approach streamlines collaboration, ensuring that non-design stakeholders remain involved in the creative process without technical bottlenecks.
Customizing Vector Elements for Specific Narratives
The true power of a vector set illustration lies in its malleability. A pre-made template provides the foundation, but your specific data tells the story. To effectively separate elements, remove unnecessary parts, or edit existing shapes, you will need a robust vector editor such as Adobe Illustrator. Within this environment, the Modern Isometric Business Infographic reveals its modular nature. Layers are typically organized logically, allowing you to isolate specific percentage info charts or statistics columns without disrupting the overall 3D perspective.
- Layer Management: Before editing, unlock and rename layers to match your project’s terminology. This prevents accidental deletion of shadow effects or lighting gradients that give the isometric style its depth.
- Color Replacement: Use global swatches to shift the purple and cyan base to match your brand guidelines while maintaining the original contrast ratios necessary for readability.
- Text Integration: Replace placeholder text with live type rather than outlining fonts immediately. This allows for last-minute data corrections without having to redraw typography.
- Element Isolation: If you only need a single 3D bar chart from a larger set, use the isolation mode to extract it cleanly, preserving its transparency and drop shadows for seamless compositing.
Practical Applications Across Industries
Versatility is a defining characteristic of this design style. The Modern Isometric Business Infographic transcends niche boundaries because data visualization is a universal need. In the SaaS and tech sectors, these illustrations are frequently used to depict server architecture, user flow funnels, or cloud computing statistics. The 3D aspect helps visualize abstract digital concepts that have no physical form, giving weight and presence to intangible software processes.
Financial institutions and fintech companies leverage these colorful percentage info charts to make annual reports less intimidating. Traditional banking visuals can feel sterile and outdated; introducing the modern purple and cyan aesthetic signals a shift toward digital-first services. Similarly, educational platforms and e-learning course creators use these diagram sets to break down complex curricula into digestible visual modules. The isometric view provides a sense of structure and order, helping learners understand hierarchical relationships between different topics or data sets more intuitively than flat lists ever could.
Optimizing 3D Presentations for Web Performance
While the source file is a vector EPS10, the end destination is often a website or digital presentation. How you export and implement your Modern Isometric Business Infographic significantly impacts user experience. For web usage, converting your edited vectors to SVG format is generally recommended over PNG or JPG. SVGs retain the infinite scalability of the original vector file and can be styled with CSS, allowing for interactive hover states or animations that bring the statistics columns to life.
However, complexity comes at a cost. Highly detailed isometric illustrations with numerous gradient meshes and blur effects can result in large file sizes. It is practical to simplify paths and reduce anchor points where possible without sacrificing visual fidelity. If the infographic contains photographic textures or extremely complex lighting, a highly optimized WebP or AVIF raster might outperform an SVG. Always test load times, as a beautiful chart that takes three seconds to render defeats the purpose of quick information consumption. Balancing the rich, colorful aesthetic of the purple and cyan theme with technical performance ensures your data looks professional and loads instantly.
Strategic Considerations Before Adoption
Before committing to a specific Modern Isometric Business Infographic asset, evaluate whether the style aligns with your long-term content strategy. Isometric design has a distinct geometric rigidity; if your brand voice is organic, hand-drawn, or minimalist, this structured 3D approach might create cognitive dissonance. Additionally, consider the density of your data. These templates excel at showing comparisons, trends, and distributions through columns and pie charts. They are less effective for dense textual explanations or qualitative storytelling.
You should also assess your team's technical capability. As mentioned, editing these files requires proficiency in vector software. If your team lacks access to Adobe Illustrator or similar tools, the customization potential of the EPS10 file remains locked. In such cases, you might need to budget for external design support or look for pre-customized variations. Ultimately, the goal is to enhance comprehension, not just decoration. When selected and executed correctly, these colorful, dimensional visuals bridge the gap between raw analytics and human understanding, making them a worthwhile investment for any data-driven communication strategy.