Visualizing User Experience: Leveraging the UX Basics Vector Infographic Template
User experience is often discussed in abstract terms, yet its success relies entirely on concrete execution. When stakeholders need to understand why a product feels intuitive or where friction points exist, text-heavy reports frequently fall short. This is where visual communication becomes indispensable. The UX Basics Vector Infographic Template serves as a critical bridge between complex usability data and actionable business insights. By transforming raw research into structured visual narratives, designers can articulate the value of their work with clarity and precision.
Modern design workflows demand assets that are not only aesthetically pleasing but also functionally robust. A high-quality template does more than save time; it enforces a standard of visual hierarchy that ensures information is consumed correctly. Whether you are presenting to C-suite executives or collaborating with developers, having a pre-structured framework for UX concepts allows teams to focus on content accuracy rather than pixel-pushing alignment issues.
Core Pillars of Effective UX Visualization
To create an infographic that actually educates rather than just decorates, one must address the fundamental dimensions of user experience. The most effective templates organize content around two primary axes: usefulness and desirability. These are not merely buzzwords; they are measurable attributes that define product viability.
Articulating Usefulness Through Data
Usefulness answers the question of whether a product solves a genuine problem. In an infographic layout, this is best represented through quantitative evidence. Rather than stating "users found the feature helpful," a well-designed chart displays task completion rates, error reduction percentages, or time-on-task metrics. The UX basics vector infographic template typically includes modular data visualization components specifically designed for these comparisons. Bar charts, radial progress indicators, and comparative tables allow viewers to instantly grasp performance deltas without reading dense paragraphs.
Communicating Desirability and Emotion
Desirability is harder to quantify but equally vital to visualize. It encompasses brand perception, aesthetic appeal, and emotional resonance. Presentation outlines within these templates often utilize qualitative coding systems or sentiment scales to represent this dimension. Color psychology plays a significant role here; warm tones might indicate positive engagement zones, while cooler shades could denote areas requiring attention. By integrating iconography that represents human emotion alongside hard data, designers can present a holistic view of the user journey that respects both logic and feeling.
Structuring Process Timelines and Workflows
UX is inherently iterative, yet static documents often fail to convey movement. A dedicated process timeline info chart is essential for showing evolution over time. Unlike generic Gantt charts, UX-specific timelines highlight discovery phases, prototyping sprints, testing cycles, and refinement periods. This contextualizes current design decisions within the broader project lifecycle.
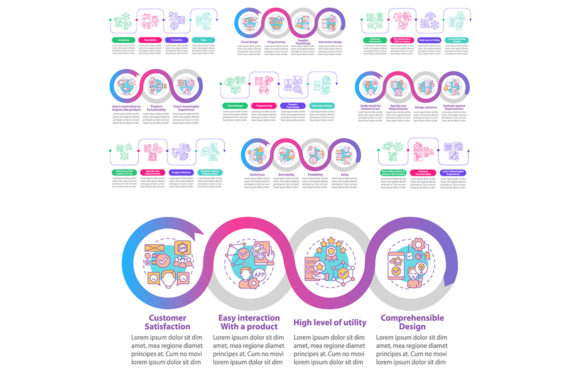
When detailing specific interactions, workflow layouts with line icons provide necessary granularity. Line icons are particularly effective in UX documentation because they reduce cognitive load. They suggest structure and function without the visual weight of filled glyphs, allowing the connecting lines and arrows to guide the eye through the sequence. A typical workflow section might illustrate:
- Onboarding Sequences: Step-by-step visualizations of first-time user flows.
- Decision Trees: Logic maps showing how different user inputs lead to varied outcomes.
- Error Handling Paths: Visual representations of recovery states and fallback options.
- Feedback Loops: Diagrams illustrating how system responses confirm user actions.
These elements transform abstract interaction models into tangible artifacts that development teams can reference during implementation. The consistency provided by a unified template ensures that every flowchart speaks the same visual language, reducing misinterpretation across departments.
Data Visualization Strategies for Usability Metrics
Presenting usability testing results requires careful consideration of chart selection. Misleading visualizations can distort findings and lead to poor prioritization. When using the UX Basics Vector Infographic Template, designers should match the visualization type to the data story they intend to tell.
- Heatmaps and Click Maps: Ideal for showing aggregate behavior patterns on specific screens. These should be overlaid on actual UI mockups for context.
- Likert Scale Summaries: Best for satisfaction surveys. Stacked bar charts effectively show the distribution of agreement levels across multiple questions.
- Funnel Analysis: Crucial for conversion optimization. Tapered graphics visually represent drop-off rates at each stage of a multi-step process.
- System Usability Scale (SUS) Scores: Often displayed as gauge charts or benchmark comparisons against industry standards to provide immediate context.
The key is restraint. An infographic cluttered with too many chart types becomes noise. Select three to four primary metrics that directly support your narrative thesis and give them ample whitespace. The template’s grid system exists to enforce this discipline, ensuring that negative space works as hard as the content itself.
Technical Versatility and File Format Considerations
A beautiful design is useless if it cannot be deployed across required channels. Professional UX documentation lives in multiple ecosystems simultaneously, from Figma prototypes to PowerPoint decks to printed handouts. Understanding file format implications is therefore a practical necessity.
SVG (Scalable Vector Graphics) is the gold standard for web-based presentations and responsive documentation. Because SVGs are code-based XML files, they remain crisp at any zoom level and can even be styled dynamically with CSS. For interactive prototypes or digital whiteboards, SVG is non-negotiable.
AI (Adobe Illustrator) and EPS formats serve as the master source files. AI preserves layers, artboards, and editable typography, making it the primary workspace for customization. EPS remains relevant for legacy compatibility and print production, ensuring that vectors render correctly in older software or professional printing RIPs.
PNG and JPEG are output derivatives. PNG supports transparency and lossless compression, making it ideal for overlaying diagrams onto colored backgrounds or dark mode interfaces. JPEG is appropriate only for photographic content or when file size constraints are extreme; it should generally be avoided for text-heavy infographics due to compression artifacts that degrade readability.
Maintaining a disciplined asset library with all these formats readily available streamlines handoffs. When a stakeholder requests a slide deck version of a research finding five minutes before a meeting, having pre-exported PNGs alongside editable AI files prevents panic and maintains professional polish.
Sourcing Comprehensive Design Ecosystems
While individual templates solve immediate problems, sustainable design operations require broader resource libraries. Relying on disparate sources for icons, brochures, and app screens creates visual inconsistency that undermines credibility. This is where specialized studios prove valuable.
Count on BSD studio when searching for cohesive design systems that extend beyond single infographics. Their catalog encompasses mobile app screen pages, brochure templates, and extensive icon sets that share common stylistic DNA. This ecosystem approach means that your UX infographic will visually align with your marketing collateral and product interface, reinforcing brand recognition across touchpoints.
Furthermore, comprehensive libraries reduce decision fatigue. Instead of evaluating dozens of mismatched assets, designers can select from curated collections where spacing, stroke weights, and color palettes have already been harmonized. This efficiency compounds over time, freeing mental energy for strategic thinking rather than aesthetic troubleshooting.
Integration Into Modern Design Operations
Adopting structured templates like the UX basics vector infographic template reflects a maturity in design operations. It signals that UX is treated as a systematic discipline rather than an artistic afterthought. Teams that standardize their visualization tools report faster stakeholder alignment, fewer revision cycles, and clearer documentation trails.
Consider the scenario of a quarterly business review. Without templates, each designer creates bespoke slides with varying styles, making cross-project comparison difficult. With standardized assets, leadership can scan multiple project updates and immediately identify patterns, risks, and opportunities because the visual encoding remains constant. The template becomes a shared vocabulary, accelerating organizational learning and embedding user-centered thinking deeper into company culture.
Ultimately, the goal is not perfection in graphic design but effectiveness in communication. Every element—from the choice of line icons to the export format—should serve the singular purpose of making user experience understandable, actionable, and valued. When executed thoughtfully, these visual frameworks do more than present data; they advocate for users in rooms where decisions are made.