Colorful Infographic Elements for Visual Impact
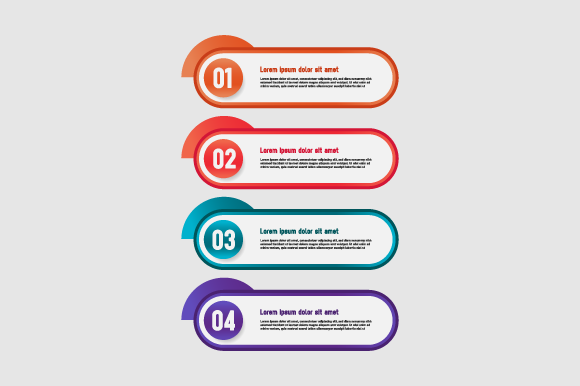
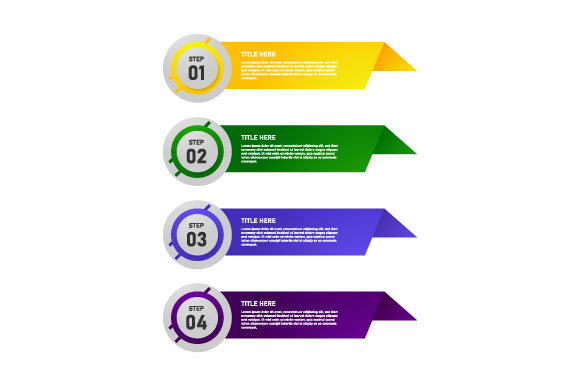
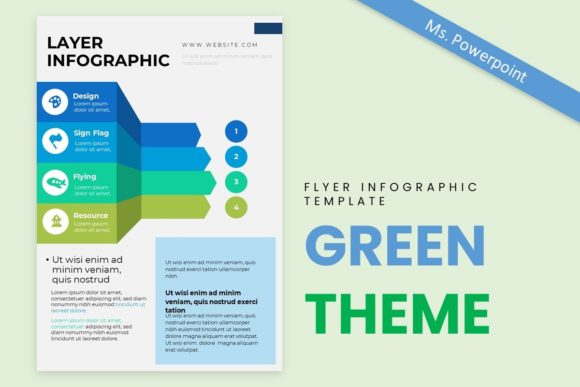
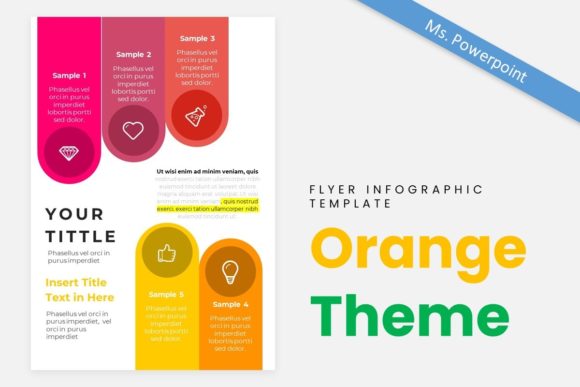
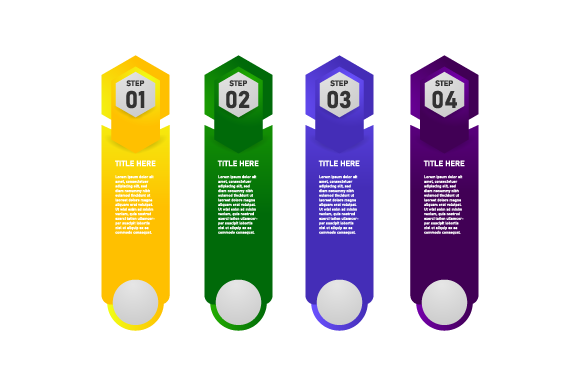
Visual communication is the backbone of modern digital storytelling, yet many creators struggle to bridge the gap between raw data and audience engagement. A Set of Colorful Infographic Element serves as that critical connector, transforming abstract statistics and complex processes into digestible, vibrant visuals. These assets are not merely decorative; they are functional design tools that guide the viewer’s eye, establish hierarchy, and inject personality into otherwise sterile presentations. Whether you are designing a corporate annual report or an educational blog post, having a versatile library of isolated vector elements allows you to build custom layouts without starting from scratch.
The true value of this collection lies in its adaptability. Because these designs are isolated on a white background, they integrate seamlessly into any existing brand identity. You are not locked into a rigid template; instead, you receive modular components that can be resized, recolored, and rearranged to fit specific narrative needs. This flexibility is essential for professionals who need to maintain visual consistency across multiple platforms while keeping production times manageable.
Maximizing File Formats for Professional Workflows
Understanding the technical specifications of your assets is just as important as the creative application. This set includes AI, EPS, JPG, and PNG files, each serving a distinct purpose in a professional workflow. Leveraging the right format ensures your final output remains crisp, editable, and optimized for its intended medium.
- AI (Adobe Illustrator): The source file for deep customization. Use this when you need to alter anchor points, merge shapes, or completely restructure an element to fit a unique layout. It preserves full editability for future iterations.
- EPS (Encapsulated PostScript): The universal vector standard. Ideal for sharing with clients or printers who may use different software like CorelDRAW or Affinity Designer. It ensures scalability without quality loss for large-format printing.
- PNG (Portable Network Graphics): Perfect for web and digital presentations. With transparent backgrounds already prepared, these files allow for instant drag-and-drop placement over colored banners, slides, or website headers without masking work.
- JPG (Joint Photographic Experts Group): Best for quick previews, mood boards, or low-resolution drafts. While not suitable for final print production due to compression, they are useful for client approvals and internal planning.
By organizing these files effectively at the start of a project, designers can switch between high-fidelity print production and rapid digital prototyping without friction. This technical readiness supports a more fluid creative process, allowing you to focus on message clarity rather than file management.
Strategic Applications Across Industries
The utility of colorful infographic elements extends far beyond traditional data visualization. Different sectors can interpret these assets to solve specific communication challenges, turning generic vectors into targeted messaging tools.
Marketing and Business Growth
For marketers and entrepreneurs, attention is a scarce currency. A well-placed infographic element can break up dense text on a landing page, increasing dwell time and comprehension. Consider using timeline elements to visualize a product roadmap or service delivery process. Instead of listing steps in bullet points, a colorful, winding path creates a sense of progression and momentum. For social media campaigns, isolated icons and charts can be animated or used as carousel slides to explain industry trends, making complex market analysis accessible to a broader audience.
Education and Training
Educators and trainers face the challenge of retention. Color coding is a proven cognitive aid; associating specific hues with different categories helps learners organize information mentally. A Set of Colorful Infographic Element provides the visual vocabulary needed to create effective study guides, workshop handouts, and e-learning modules. For example, comparative diagrams can illustrate historical events or scientific processes, while circular flowcharts can demonstrate cyclical systems like ecosystems or economic models. The key is to use color functionally, ensuring it reinforces the learning objective rather than distracting from it.
Content Creation and Blogging
Bloggers and publishers often need to create original visuals to support SEO and shareability. Custom infographics are among the most linked-to content types on the web. By combining these vector elements, creators can produce unique featured images that stand out in search results and social feeds. Rather than relying on stock photos that lack specificity, assembling infographic elements allows you to visualize niche topics—from personal finance budgeting to wellness routines—with precision and style.
Design Principles for Clarity and Consistency
Access to vibrant assets does not guarantee effective design. To ensure your infographics remain clear and professional, apply fundamental design principles that prioritize readability and user experience.
Establishing Visual Hierarchy
Color should serve structure. Use the most saturated or contrasting colors for primary data points and key takeaways, while reserving muted tones for secondary information and background elements. This guides the viewer through the content in a logical sequence. Avoid treating every element with equal visual weight; if everything screams for attention, nothing gets heard. The isolated nature of these vectors makes layering easier, allowing you to build depth and focus intentionally.
Maintaining Brand Alignment
While the set is inherently colorful, successful adaptation requires aligning it with your brand palette. Use the AI or EPS files to adjust global colors to match your corporate identity or project theme. Consistency builds trust. If your brand uses cool blues and teals, warming up the infographic elements to include complementary oranges or yellows can add energy without breaking recognition. Create a master style guide for your infographic usage to ensure that fonts, stroke weights, and color applications remain uniform across all deliverables.
Balancing Density and Whitespace
A common pitfall in infographic design is overcrowding. These elements are designed to be modular, but that doesn't mean you should use every piece available. Negative space is active space; it gives the eye room to rest and process information. When arranging elements for a banner or poster, group related items together and separate distinct concepts with ample breathing room. This organization prevents cognitive overload and makes the content feel curated and professional.
Creative Variations and Customization Ideas
To keep your visual content fresh, explore different stylistic interpretations of the base assets. The vector format invites experimentation that raster images cannot offer.
- Isometric Adaptation: Rotate and skew flat elements to create pseudo-3D compositions. This adds a modern, tech-forward aesthetic suitable for SaaS companies and innovation reports.
- Minimalist Reduction: Strip back gradients and shadows to create flat, solid-color versions. This approach works exceptionally well for mobile-first designs where screen real estate is limited and clarity is paramount.
- Texture Integration: Overlay subtle grain or paper textures onto the vector shapes within Illustrator. This softens the digital perfection of the graphics, adding warmth and tactility that resonates with lifestyle and artisanal brands.
- Interactive Modular Systems: For web designers, treat individual elements as interactive states. A chart segment could highlight on hover, or a process icon could animate when scrolled into view. Planning for interaction during the static design phase ensures smoother development later.
Ultimately, a Set of Colorful Infographic Element is a foundation for visual problem solving. It empowers creators to move beyond generic templates and craft bespoke communications that resonate with their specific audiences. By combining technical proficiency with strategic design thinking, these assets become more than just pretty pictures—they become essential instruments for clarity, engagement, and professional expression. Whether you are refining a pitch deck, teaching a complex concept, or enhancing a digital platform, the ability to manipulate and adapt these elements ensures your message is not only seen but understood and remembered.