Soil Ground Infographic: Isometric Style Guide
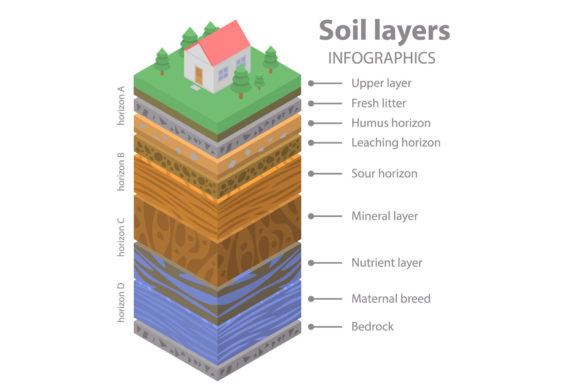
Visualizing the complex layers beneath our feet requires more than a standard flat diagram. When communicating environmental data, agricultural processes, or geological structures, depth and dimension are not just aesthetic choices; they are functional necessities. The Soil Ground Infographic in an isometric style bridges the gap between technical accuracy and visual engagement. By presenting soil horizons, root systems, and subterranean infrastructure in a 2.5D perspective, designers can convey spatial relationships that top-down views simply cannot capture. This specific visual approach transforms dry scientific data into an accessible narrative, making it an essential asset for web design, educational materials, and commercial presentations.
The Strategic Value of Isometric Soil Visualization
Isometric projection offers a unique advantage for soil-related content because it maintains consistent scale across all three axes. Unlike perspective drawing, where objects diminish in size as they recede, isometric art keeps measurements uniform. For professionals explaining soil composition, this means the relative thickness of the O, A, B, and C horizons remains accurate and readable. Viewers can instantly compare layer depths without visual distortion interfering with the data.
Beyond measurement, this style excels at showing interaction. Soil is rarely static; it is a living system where water percolates, roots penetrate, and organisms migrate. An isometric soil ground infographic allows you to illustrate these vertical movements clearly. You can show irrigation lines running through specific strata or demonstrate how contaminants move through groundwater tables. This clarity reduces cognitive load for the audience, allowing them to grasp complex subsurface dynamics quickly. For marketers and educators, this translates to higher retention rates and more effective communication of value propositions or learning objectives.
Key Characteristics of High-Quality Assets
Not all vector graphics are created equal. When evaluating a soil ground infographic for professional use, several distinct qualities separate premium assets from generic clip art. Texture fidelity is paramount. Soil should look like soil, not just a block of brown color. High-quality isometric vectors utilize subtle gradients, noise patterns, or stippling to suggest organic matter, clay density, or sandy loam without becoming photorealistic. This balance ensures the graphic remains scalable while retaining tactile authenticity.
Color coding serves as the primary language in these infographics. Effective designs adhere to established scientific conventions—dark browns for humus-rich topsoil, reddish hues for iron-oxide clay, and pale yellows for subsoil—while maintaining enough contrast for digital screens. Accessibility matters here; ensure the palette remains distinguishable for users with color vision deficiencies. Additionally, look for modularity. The best isometric soil assets are constructed with separated layers and grouped elements. This structural integrity allows you to toggle visibility, swap out vegetation types, or adjust horizon depths within your editing software without breaking the overall composition.
Practical Applications Across Industries
The versatility of the isometric soil ground infographic extends far beyond geology textbooks. Different sectors leverage this visual format to solve specific communication challenges. Understanding these use cases helps professionals select the right asset variation for their needs.
- Sustainable Agriculture & AgTech: Startups and established farms use these visuals to explain precision farming techniques. Showing sensor placement at varying soil depths or illustrating drip irrigation efficiency helps investors and farmers understand technology integration. The isometric view clarifies how hardware interacts with biological zones.
- Environmental Consulting & Remediation: Consultants often need to explain contamination plumes or remediation strategies to non-technical stakeholders. A clean isometric cross-section can demystify site assessments, showing exactly where pollutants sit relative to aquifers and building foundations. This builds trust through transparency.
- Landscape Architecture & Urban Planning: Designers use soil infographics to justify planting selections or drainage solutions. Visualizing the relationship between hardscape, topsoil volume, and native root depth supports proposals and permits. It moves the conversation from abstract specs to tangible ecosystem function.
- Educational Publishing & E-Learning: Textbooks and online courses rely on these graphics to teach earth science. The consistent angle helps students build mental models of subsurface structure. Interactive web versions, built from layered vectors, allow learners to explore different soil types by toggling elements.
- Gardening & Home Improvement Content: Bloggers and influencers use stylized soil diagrams to create shareable, Pinterest-friendly content. Explaining composting layers or raised bed construction becomes visually intuitive, driving engagement and establishing authority in the niche.
Navigating File Formats for Maximum Efficiency
Selecting the correct file format is as critical as choosing the visual style itself. Most comprehensive soil ground infographic packages include JPG, EPS, AI, PSD, and PNG options, each serving a distinct purpose in the production workflow. Understanding when to deploy each format saves time and preserves quality.
AI (Adobe Illustrator) and EPS files are your master sources. These vector formats allow infinite scaling without pixelation, making them ideal for everything from business cards to billboards. Use these when you need to edit colors, reshape horizons, or integrate custom typography. They are also the preferred delivery format for print production and large-format signage. Always keep an archived copy of the vector source, even if you currently only need a raster image.
PSD (Photoshop) files offer a middle ground for those who prefer pixel-based editing or need advanced texture work. Layered PSDs retain editability for color grading, masking, and compositing with photographic elements. This format is particularly useful when combining the isometric soil graphic with realistic background imagery or when preparing high-resolution textures for 3D rendering workflows.
PNG and JPG serve immediate digital deployment needs. PNGs with transparent backgrounds are essential for web design, allowing the soil graphic to float over colored sections or integrate seamlessly into UI components. They preserve crisp edges and support alpha channels. JPGs remain the standard for document embedding, email newsletters, and social media posts where file size impacts load times or delivery success. Always export web-ready versions at appropriate resolutions to balance clarity with performance.
Implementation Best Practices and Considerations
Integrating an isometric soil ground infographic into your project requires thoughtful execution. Placement and context determine effectiveness. On websites, ensure the graphic has adequate whitespace; crowding it with text diminishes its impact. Consider using it as a hero element or alongside step-by-step process descriptions rather than burying it in dense paragraphs. For responsive design, verify that critical labels remain legible on mobile devices. You may need to create simplified mobile-specific versions that remove secondary details while preserving core messaging.
Consistency is equally important. If your brand uses flat design elsewhere, introducing a detailed isometric soil graphic can feel jarring unless bridged thoughtfully. Match line weights, corner radii, and color saturation to your existing visual system. Customization is not optional; it is necessary for cohesion. Adjust the asset’s lighting direction to match other isometric elements on the page. Mismatched light sources create subconscious dissonance that undermines professionalism.
Finally, consider accessibility and SEO. While search engines cannot interpret vector graphics directly, descriptive alt text and surrounding contextual content make the infographic discoverable. Describe what the image shows functionally: "Isometric cross-section showing three soil horizons with root penetration and moisture levels" performs better than generic tags. Provide text-based alternatives or captions for screen reader users. This inclusive approach expands your reach and aligns with modern web standards. Remember that the goal is communication, not decoration. Every element in your soil ground infographic should earn its place by clarifying, informing, or guiding the viewer toward understanding.