CPS Application Vector Infographic Design Guide
Communicating the intricate relationships between physical processes and computational algorithms requires more than standard bullet points. The CPS Application Vector Infographic serves as a specialized visual framework designed to bridge the gap between complex cyber-physical systems and stakeholder understanding. Whether you are presenting smart grid infrastructure updates or medical monitoring protocols, this template provides the structural clarity necessary to convey technical workflows without overwhelming your audience. By utilizing pre-designed vector assets, professionals can transform abstract data into tangible narratives that support informed decision-making and strategic planning.
Visualizing Complex System Interactions
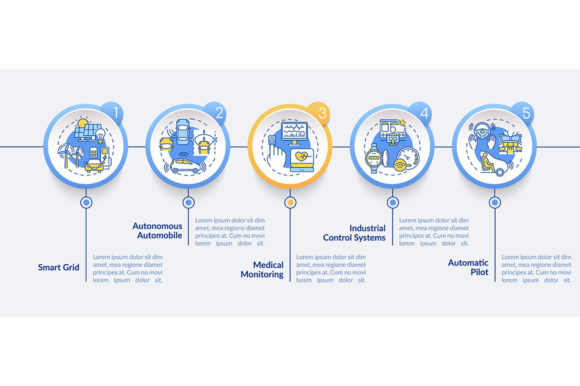
Cyber-Physical Systems (CPS) integrate sensing, computation, control, and networking into physical objects. Explaining these integrations often fails when relying solely on text or generic stock imagery. The CPS Application Vector Infographic addresses this challenge by offering design elements specifically tailored for technical environments. For instance, the included smart grid components allow energy sector professionals to map out power distribution networks alongside real-time data feedback loops. Similarly, the medical monitoring presentation elements provide healthcare administrators with accurate iconography for patient telemetry and remote diagnostic systems.
This specificity matters because it establishes immediate credibility. When an engineer presents a workflow using generic business icons, the audience must mentally translate those symbols into technical realities. Using domain-specific vectors eliminates this cognitive load. The viewer instantly recognizes a transformer symbol or a biometric sensor, allowing them to focus on the system logic rather than deciphering the graphics. This alignment between visual language and technical content is essential for maintaining engagement during high-stakes presentations where precision is paramount.
Structuring Narratives with Five-Step Data Visualization
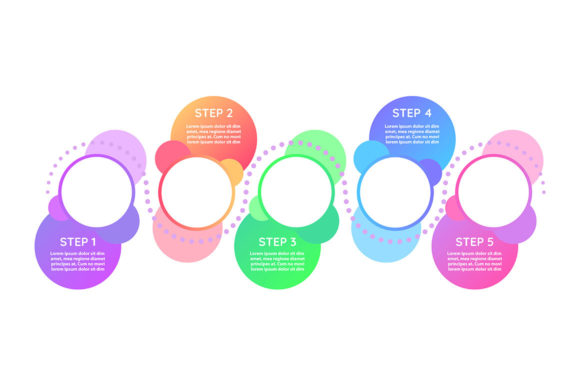
One of the most practical features of this template is the integrated five-step data visualization layout. Technical processes rarely happen in isolation; they follow sequential logic that must be understood chronologically. This structured approach forces presenters to distill complex operations into digestible phases. Instead of displaying a chaotic web of connections, you can guide stakeholders through a linear progression: data acquisition, transmission, processing, actuation, and feedback.
Consider a manufacturing plant manager explaining a new predictive maintenance protocol. Using the five-step framework, they can clearly delineate where sensors collect vibration data, how that data moves to the cloud, the AI analysis phase, the alert generation, and the final mechanical adjustment. This structure prevents information overload and ensures that non-technical executives understand the value proposition at each stage. It also serves as a checklist for completeness; if a step cannot be visualized within this framework, it may indicate a gap in the process definition or communication strategy.
Leveraging Process Timeline Charts for Project Management
Beyond operational workflows, the CPS Application Vector Infographic includes process timeline charts that are invaluable for project planning and status reporting. Implementing cyber-physical systems involves long deployment cycles with critical milestones. A well-designed timeline communicates progress more effectively than a spreadsheet. The linear icons provided in the template allow users to mark specific achievements—such as hardware installation, software integration, beta testing, and regulatory approval—with consistent visual markers.
This capability supports better resource allocation and expectation management. When a team sees a visual representation of the remaining steps compared to completed ones, they gain an intuitive sense of project velocity. For freelancers and consultants, these timelines demonstrate professionalism and organizational competence. They transform abstract delivery dates into a visual roadmap that clients can track and understand. However, users should ensure the timeline reflects realistic dependencies; a beautiful chart that ignores technical bottlenecks will ultimately undermine trust.
Workflow Efficiency Through Linear Iconography
The aesthetic choice of linear icons in this template is not merely stylistic; it is functional. In dense technical diagrams, heavy or filled icons can create visual noise that obscures connecting lines and data flows. Linear icons maintain a light visual weight, allowing the relationships between system components to take precedence. This is particularly important when mapping smart grid networks or hospital monitoring systems where connectivity is the primary story.
For creators and marketers, this design consistency saves significant production time. Sourcing individual icons that share the same stroke weight, corner radius, and style is a tedious process that often results in mismatched visuals. Having a cohesive set ensures that every slide or document maintains a unified brand identity. This consistency extends across different media formats, ensuring that a report cover matches the internal slides and the web summary. The result is a polished, professional appearance that suggests attention to detail in both design and engineering.
Maximizing Utility Across File Formats
The practical value of the CPS Application Vector Infographic is amplified by its comprehensive file format inclusion. The ZIP package contains EPS, JPG, PNG, SVG, and AI files, each serving distinct use cases for different professionals. Understanding when to use each format ensures optimal quality and workflow efficiency.
- AI and EPS: Essential for designers and agencies who need to modify colors, resize elements without quality loss, or integrate components into larger custom illustrations. These source files provide maximum flexibility for print materials and large-format displays.
- SVG: Ideal for web developers and digital publishers. Scalable Vector Graphics ensure crisp rendering on all screen sizes and can be animated or styled with CSS for interactive web presentations.
- PNG: Best for quick insertion into documents, emails, or slide decks where transparency is needed but vector editing is not. Useful for bloggers and educators creating static content.
- JPG: Suitable for universal compatibility when transparency is unnecessary, such as social media posts or basic image placeholders.
This multi-format approach acknowledges that CPS communication happens across diverse platforms. An educator might only need PNGs for a lecture slide, while a systems integrator requires AI files for a detailed technical manual. Providing all options eliminates friction and ensures the asset remains useful regardless of the user's technical proficiency or software access.
Strategic Considerations and Limitations
While the CPS Application Vector Infographic template offers significant advantages, users should apply it thoughtfully. Templates provide structure, but they cannot replace domain expertise. The five-step model, for example, is excellent for linear processes but may oversimplify highly recursive or parallel systems. In such cases, professionals should adapt the template rather than forcing their content into an ill-fitting mold. Customization is key; the provided vectors are starting points, not constraints.
Additionally, consider the audience's familiarity with CPS concepts. For expert audiences, the template’s technical accuracy is a major asset. For general consumers or investors unfamiliar with cyber-physical systems, you may need to supplement the infographic with explanatory annotations or simplified labels. The visual elements communicate "what" and "how," but the presenter must still articulate the "why." Comparing this template against generic business infographics reveals its niche strength: it trades broad applicability for technical relevance. If your work involves IoT, automation, or connected infrastructure, this specialization justifies the investment. For general marketing unrelated to technology, a broader template might serve better.
Ultimately, effective technical communication balances aesthetic appeal with informational integrity. This infographic template supports that balance by providing professionally designed, semantically appropriate visual building blocks. It enables engineers, educators, and entrepreneurs to spend less time wrestling with design software and more time refining their message. By leveraging these specialized assets, you ensure that your presentation of smart grid data, medical monitoring workflows, or system architectures is as robust and reliable as the technology itself.